
By Jack | 25 October 2026
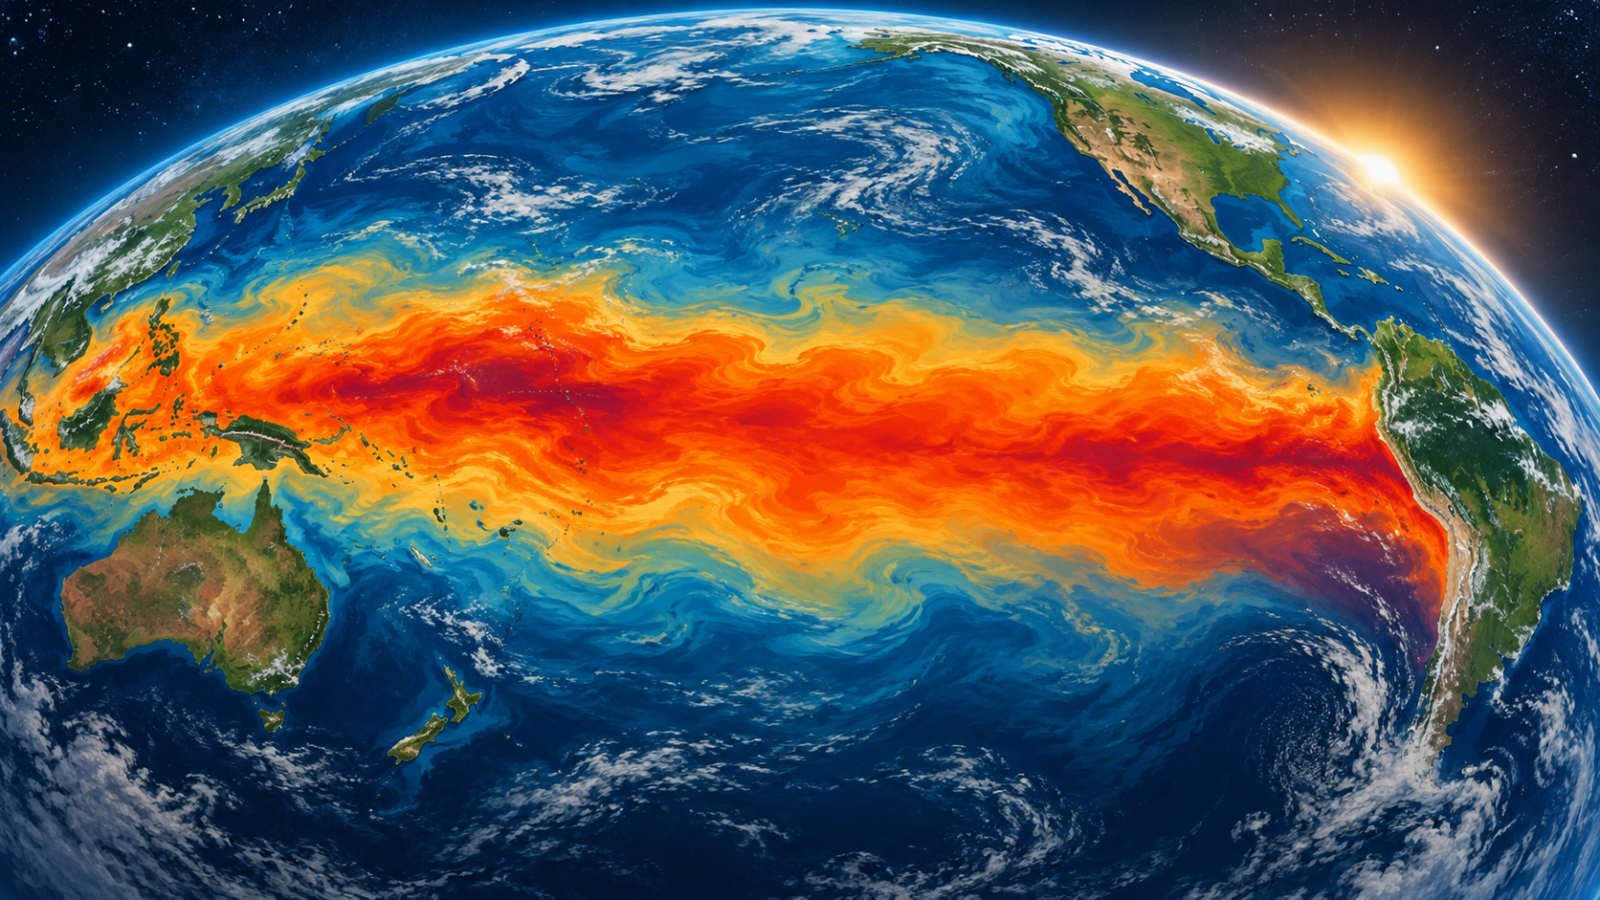
NASA Earth Observatory has published a comparison of Pacific sea-surface height patterns in October 2026 and October 1997. Its 23 October feature shows higher-than-normal sea levels across the central and eastern equatorial Pacific, a pattern associated with El Niño.
The images compare 12 October 2026 with 13 October 1997, drawing on a long satellite-altimetry record. NASA notes the broad resemblance to the earlier major event. These are sea-height anomaly maps, not direct maps of forecast rainfall at a particular address.
Read the variable before reading the colours
A coloured climate map is meaningful only alongside its legend, units, reference period and observation date. “Above normal” means a difference from a specified baseline; it does not mean every point is at the same absolute height or temperature.
The comparison is useful because it puts the present pattern beside a historical case using an observational framework. It is less useful if the image is circulated without the date or mistaken for a local warning.
Resemblance is a starting point, not a forecast
Two large-scale patterns can look similar while the timing and effects experienced in individual places differ. A historical comparison helps frame questions, but decisions about flood, heat or drought preparations require current regional forecasts and local official guidance.
Readers evaluating a claim that this year will “repeat 1997” should ask what is actually being compared: ocean height, temperature, winds or a particular impact. A conclusion about one variable should not silently become a prediction about all the others.
This report explains the published satellite comparison and does not supply a weather forecast. For another example of separating an offshore observation from its effects on land, see our Josephine image explainer.
Reporting note: Prepared with AI assistance using the linked sources. No on-site reporting, interviews or independent testing is claimed. Thumbnail: AI-generated conceptual illustration, not a documentary photograph or measured data. Corrections: support@globaldailytimes.com.



Leave a Reply