
By Jack | 22 October 2026
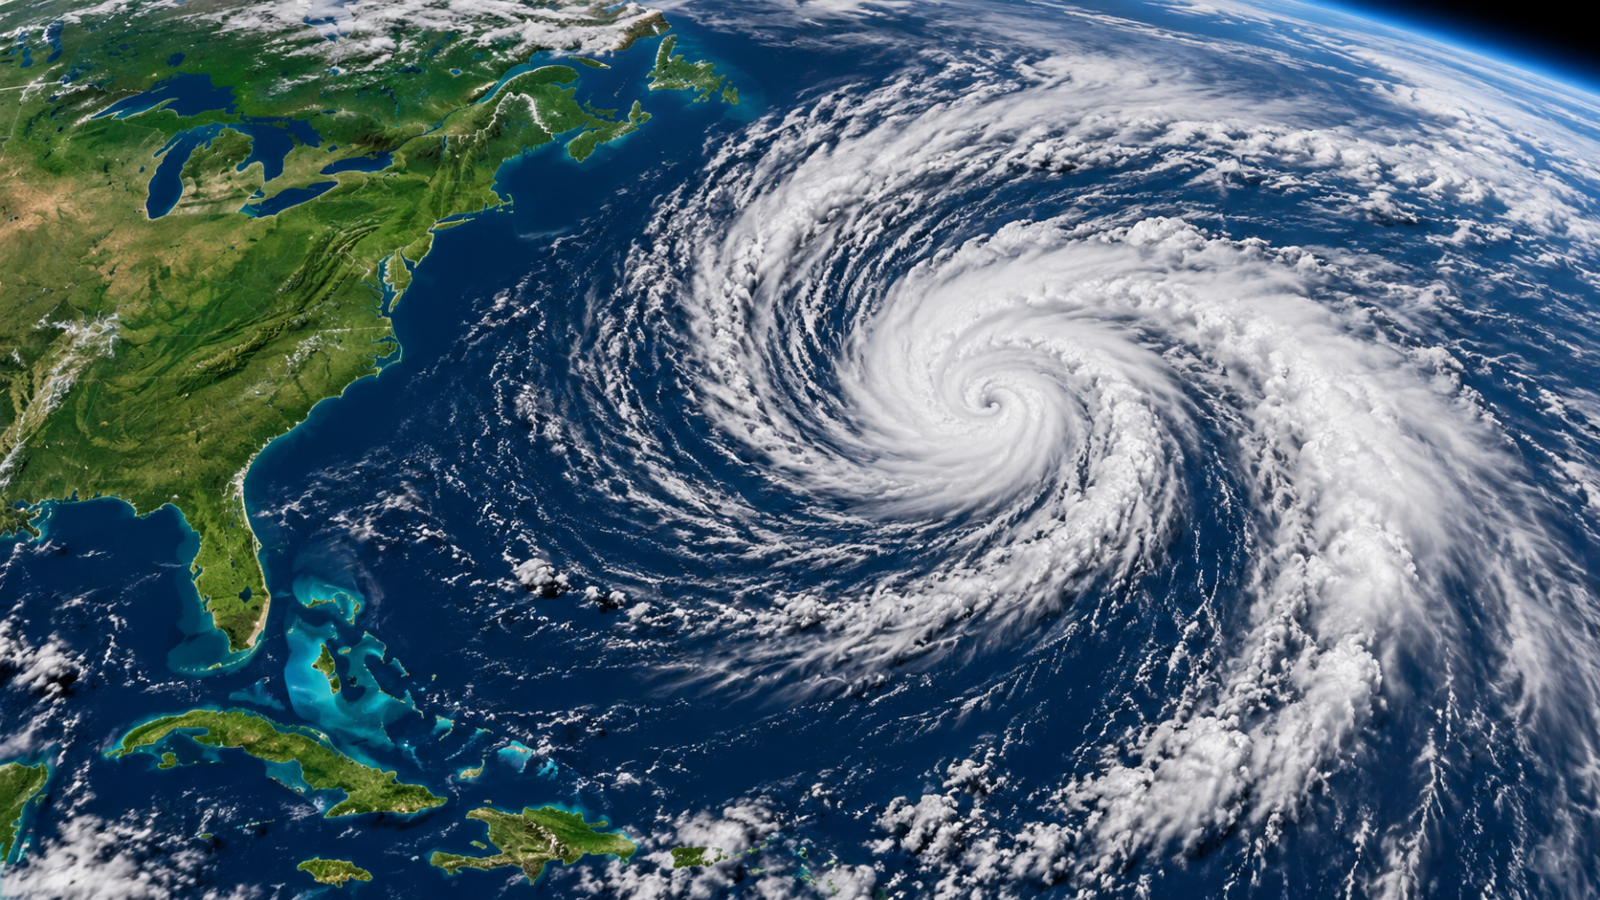
NASA’s MODIS image feature for 22 October highlights Subtropical Storm Josephine after its naming the previous day. The NASA account says Terra acquired the image on 21 October, showing an uneven cloud system with stronger convective bands to the west of its centre.
At the time described in the feature, Josephine was about 300 miles east of Ocean City, Maryland, with maximum sustained winds of 65 mph. NASA reported that outer bands brushed parts of the US East Coast. These figures describe the dated observation; they should not be read as a live position or current intensity.
What “subtropical” explains
NASA describes a subtropical cyclone as a hybrid drawing energy from warm ocean water and temperature contrasts between air masses. The label describes the system’s structure and energy sources. It does not, on its own, tell a coastal resident whether local conditions are safe.
The feature is a useful example of why a storm’s centre and its wider effects need to be considered separately. A map showing a centre offshore does not describe every place reached by the surrounding circulation or waves.
Read the timestamp before using a weather image
There are at least three clocks in a story like this: the image acquisition time, the publication time and the validity time of an operational forecast. A new article can contain yesterday’s observation, while a later advisory may already describe changed conditions.
For practical decisions, use the latest National Hurricane Center advisories and the warnings issued by your local weather authority. This article does not reproduce a current forecast track or replace an official warning.
The value of the satellite view is explanatory: it shows the distribution of cloud around the storm at a particular moment. It cannot establish local wind, wave or flooding conditions by itself. Matching an image to its date and to current official information is essential to interpreting it accurately.
Reporting note: Prepared with AI assistance from the official sources linked above. No on-site reporting or independent testing is claimed. Corrections: support@globaldailytimes.com.



Leave a Reply